

ADSCIENCE® DATA VISUALIZATION
Clarity You Can See. Insights You Can Act On.
Stop digging through disconnected reports. AdScience Data Visualization turns complex marketing data into clear, real-time dashboards—so you can see what’s working, why it’s working, and where to act next.
THE CHALLENGE: INFORMATION OVERLOAD,
INSIGHT DEFICIT
More data doesn’t mean more knowledge. Without the right tools to interpret and apply it, marketing data remains an untapped resource.
CLUTTERED REPORTS, OBSCURED VISIBILITY
Spreadsheets and static reports bury essential trends in noise.
LIMITED REAL-TIME VISIBILITY
Monitoring performance across channels is time-consuming and reactive.
FRAGMENTED SYSTEMS, FRAGMENTED THINKING
Siloed platforms obscure visibility into the complete customer journey.
SLOW DECISIONS, MISSED OPPORTUNITIES
Lack of visual clarity delays action, limiting ROI and responsiveness.

THE SOLUTION: ADSCIENCE INTELLIGENT DATA VISUALIZATION
AdScience equips marketing leaders with a centralized, visual command center. Its dynamic dashboards transform scattered data into focused intelligence, unlocking clarity within every campaign.
CUSTOMIZABLE DASHBOARDS
Display only the KPIs that matter most—tailored by user role, business objective, or location—so everyone sees what’s relevant and actionable.
REAL-TIME MONITORING
Track live performance data across all campaigns, channels, and locations—enabling faster decisions and immediate course correction.
MULTI-CHANNEL REPORTING
Measure results across paid, owned, and earned media from a single interface, giving you a unified view of cross-channel performance.
AI-DRIVEN TREND DETECTION
Uncover emerging patterns, performance spikes, and behavioral shifts with machine learning that flags what’s changing—before it impacts results.
DRILL-DOWN ANALYTICS
Click into the metrics that matter most to explore campaign-level performance, location-specific trends, or creative effectiveness—without the wait.
KEY ADSCIENCE BENEFITS FOR MARKETING LEADERS
Implementing AdScience delivers:

Clarity at a Glance
See all campaign activity from a single, visual interface.

Strategic Clarity
Empower your team to act on insights to drive “next best action” for all customer segments.

Smart Automation
Replace manual reporting with intelligent, automated analytics.

Improved ROI Visibility
Know which efforts deliver real value and adjust investment accordingly.

Shared Visibility
Enable cross-functional teams to rally around a shared source of marketing truth.

REAL-WORLD IMPACT: VISUAL INTELLIGENCE THAT MOVES THE NEEDLE
Marketing teams that implement the AdScience Data Visualization experience immediate improvements in clarity, speed, and performance:
30% FASTER DECISION-MAKING WITH REAL-TIME VISUAL DASHBOARDS
40% REDUCTION IN REPORTING TIME BY AUTOMATING MANUAL DATA WORKFLOWS
25% INCREASE IN OPERATIONAL EFFICIENCY THROUGH CENTRALIZED, ACCESSIBLE INSIGHT DELIVERY

HOW ADSCIENCE STANDS OUT
Where most analytics platforms stop at data display, AdScience begins with understanding. It doesn’t just visualize numbers—it reveals what they mean and what to do next.
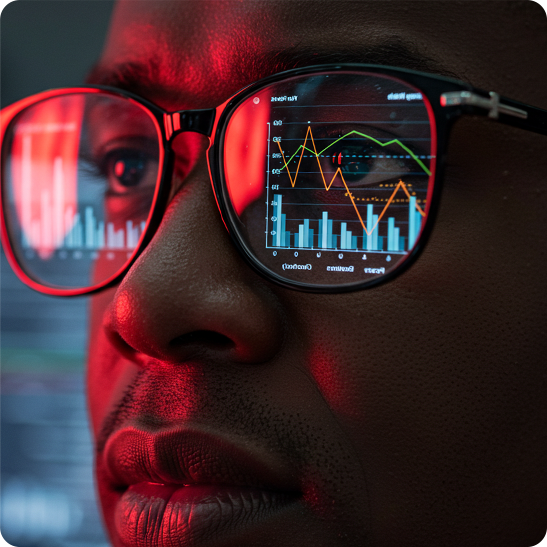
AI-Powered Insights: Automatically surfaces the metrics that matter most—no manual digging required.
Cross-Channel Integration: Unifies digital, traditional media data and sales information to reflect a full view of activity and performance.
Interactive, Dynamic Dashboards: Explore your data with flexible filters and pre-built drill-downs.
Collaboration-Ready Tools: Easily share reports across teams, fostering informed, collective decision-making.
TURN YOUR DATA INTO A COMPETITIVE ADVANTAGE
When your team sees clearly, it thinks clearly—and acts wisely. Let AdScience Data Visualization show you not just where you stand, but where to move next.