




HOUSE FLIPPING STATISTICS 2026

What the Real Estate Investor Data Actually Shows


Margins ticked up for the first time in nearly two years during Q1 2026, even as the overall number of flips kept shrinking. (ATTOM, Q1 2026 U.S. Home Flipping Report) That combination of improving profitability alongside falling volume is the real story underneath every headline statistic in this report.

Looking at either number in isolation misses what is actually happening.

The investors still active in today’s market are operating in a different environment than they were just a few years ago. Margins remain well below historical highs. Market selection matters more than ever. Capital is becoming a competitive advantage. And success increasingly depends on disciplined execution rather than broad market appreciation.

This report examines what the latest real estate investor fix-and-flip data actually says about the market, where investors are finding opportunity, and the trends likely to shape the rest of 2026.


EXECUTIVE SUMMARY

THE HEADLINE NUMBERS


METRIC LATEST DATA
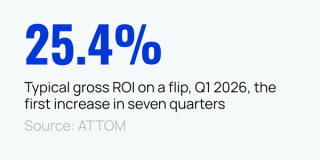
Typical gross ROI on a flip 25.4% in Q1 2026, the first increase in seven quarters (ATTOM)
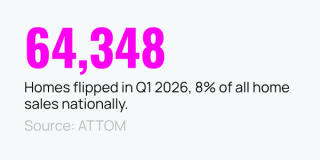
Houses flipped in Q1 2026 64,348, representing 8% of all home sales nationally (ATTOM)
Full-year 2025 volume 297,045 flips, or 7.4% of home sales, with the lowest annual ROI (25.5%) since 2007 (The Motley Fool)
Investors expecting to complete a flip 90% of active flippers say they are likely to complete a project during the next 12 months (LendingOne–ResiClub)
Investors planning to buy more houses 71% expect to purchase more houses in 2026 than they did in 2025, the highest share on record (Kiavi)


WHAT THIS MEANS FOR INVESTORS

Transaction and sentiment data are telling two different stories right now. Both are true.

Fewer investors are buying, but the ones still buying are competing harder for the same deals. In Buffalo and Cleveland, where cash purchases now account for 81% and 77.4% of flips respectively, that competition is showing up directly in acquisition speed rather than acquisition volume — deals are getting won faster, by better-capitalized buyers, in a smaller pool. That’s the shape of a market that’s contracted in size but concentrated in strength.

TRANSACTION DATA

The transaction data indicates the pool of active flippers is shrinking.

  • Fewer houses are being flipped
  • Margins remain well below the 2016 through 2020 era
  • The market is still working through a correction that began in 2022

SENTIMENT DATA

The sentiment data tells a different story. The investors still in the market are unusually confident. That is not really a contradiction.

The undercapitalized and speculative investors largely exited during the 2023 shakeout, when annual flip volume dropped 24% in a single year. What remains is a smaller, better-capitalized group that is naturally more bullish because the operators who would not have been are already gone.


Key Takeaway   Today’s market looks less like the beginning of a broad recovery and more like the profile of a market that has already completed its shakeout.


It’s also worth putting today’s returns into a historical perspective. A 25.4% gross ROI sounds healthy in isolation, but it is still less than half of the 54% investors were earning in 2016. (ahlend, Best Fix and Flip Markets in 2026)

That gap is the real headline. This is not a market waiting to bounce back to its old normal. It is operating under a new one.


WHERE THE MARKET STANDS RIGHT NOW


THE 2026 NUMBERS YEAR TO DATE

The first quarter of 2026 delivered the first improvement in flipping returns in nearly two years.

Gross profits increased from $64,300 during the previous quarter to approximately $66,000. While encouraging, that figure still trails the $74,172 typical profit recorded during Q1 2025. (ATTOM) ATTOM CEO Rob Barber described the improvement as a welcome sign for investors while emphasizing that profitability continues to depend heavily on local market conditions.

The market is showing signs of stabilization. It is not yet showing signs of a broad recovery.


BULLISH SENTIMENT, CAUTIOUS REALITY

53%

Of real estate flippers describe their local market as somewhat or very strong

75%

Expect strong buyer demand over the next 12 months (LendingOne–ResiClub)

71%

Plan to increase purchase activity in 2026 compared to 2025 (Kiavi)

83%

Of Midwest investors describe buyer demand as strong or very strong, the most optimistic region in the country

Regional confidence is not evenly distributed. None of this contradicts the decline in transaction volume discussed above. It’s simply the same market viewed from two different perspectives. Overall activity continues to contract, while investors who remain active are becoming increasingly confident in their ability to compete.


Key Takeaway   Confidence is improving because many weaker investors have already left the market, not because the market has returned to the conditions investors experienced several years ago.


BEST REAL ESTATE MARKETS FOR FLIPPING HOUSES IN 2026

The national ROI figure — 25.4% in Q1 2026 — is useful for understanding broad market conditions. It is much less useful for deciding where to invest.

Behind the national average sits an increasingly wide gap between local markets, and that spread has grown rather than narrowed as the housing market has cooled. Today, market selection has become one of the single biggest drivers of flip profitability.

Some metros produce gross returns above 100%. Others have become some of the most difficult markets in the country for investors to generate meaningful returns. For operators deciding where to deploy capital, local conditions now matter far more than the national average.


THE METROS OUTPERFORMING THE MARKET

The differences between local markets have become impossible to ignore. While national profitability remains relatively modest, several metros continue to produce exceptional returns because the underlying fundamentals look very different from the country as a whole.


METRO RECENT GROSS ROI WHAT’S DRIVING IT
Buffalo, NY 109%+ Inventory remains well below pre-pandemic levels, while buyer demand continues to benefit from households priced out of coastal metros. (StraightLine Funding, Top 10 Fix and Flip Markets)
Pittsburgh, PA 106.8% A relatively low flip rate of approximately 4.6% of home sales has helped limit investor competition despite strong market fundamentals. (ahlend)
Hartford, CT Zillow’s #1 hottest U.S. market for 2026 Inventory sits roughly 63% below pre-pandemic levels, supported by continued migration from New York City. (Kiavi)
Cleveland, OH 72% (up from 39.2% in 2023) The largest year-over-year ROI improvement of any major metro. (StraightLine Funding)


EMERGING MARKETS WITH STRONG FUNDAMENTALS

Buffalo, Pittsburgh, Hartford, and Cleveland aren’t the only markets rewarding disciplined investors right now. A second tier of metros shares the same underlying driver — constrained supply relative to demand — just at different entry prices and with less competition than the locations above.


TIER 2 METROS ALSO DRIVING THE MARKET

These markets don’t show up on every “best of 2026” list yet, but the underlying data supports them. Expect more competition here as the word gets out.

Birmingham, AL — A typical deal here runs about $85,000 to purchase, $42,000 in renovation, targeting an ARV of $185,000 to $200,000. Alabama ranked sixth nationally for net inbound migration in 2024, and renovation costs in Birmingham run 15% to 25% below the national average. (StraightLine Funding)

Indianapolis, IN — Frequently cited as a lower-friction market for newer investors, with predictable permitting and a landlord-friendly legal environment that supports a fallback rental exit if a flip doesn’t sell quickly. (RealEstateSkills)

Charlotte, NC — Active listings are absorbed quickly, often in under 20 days. The tradeoff is a higher entry price, with a median around $434,740, which means carrying costs scale up fast on hard-money financing. (Ridge Street Capital)

Cincinnati, OH — Alongside Cleveland and Columbus, Cincinnati offers affordable entry points and gross margins potentially well above the national average, per ATTOM’s Q3 2025 data. (Kiavi)

Columbus, OH — A typical deal structure runs purchase prices of $140,000 to $180,000, rehab budgets of $50,000 to $70,000, and an ARV of $285,000 to $340,000. The metro’s Q2 2025 flip rate of 13.6% was third highest nationally, supported by Intel’s $20 billion chip manufacturing investment and steady rental demand tied to Ohio State University. (ahlend)

Memphis, TN — One of a small group of metros with strong rental fundamentals running alongside retail demand, which makes it well suited to the fix-to-rent hybrid strategy. (StraightLine Funding)

Milwaukee, WI — Ranked by Zillow among the best markets for 2026. Median price sits near $230,000, up 9.5% year over year. Older duplex housing stock can often be acquired for $100,000 to $150,000 in some neighborhoods. (Kiavi)

These markets share the same underlying driver as the top performers above: constrained supply relative to demand. The difference is entry price, and how much competition has already found them.

THE METROS FALLING BEHIND

Not every market has benefited from the same conditions. Several areas that experienced rapid population growth and heavy residential construction during the early 2020s are now seeing the opposite effect. Increased housing supply has made resale more difficult while acquisition prices remain relatively elevated.

MARKET PERFORMANCE WHY
Texas metros Six of the ten worst-performing U.S. metros in 2025 were located in Texas. New construction has outpaced buyer demand, creating downward pressure on resale values. (The Motley Fool)
Montana (statewide) 1.2% gross ROI The weakest statewide return recorded during 2025. (The Motley Fool)


Gross ROI reflects only the spread between purchase and resale price. It does not include renovation, holding, financing, or transaction costs, meaning actual net returns are typically 15 to 25 percentage points lower.

High flip activity doesn’t always mean high opportunity. Georgia led the nation in flip activity in late 2025, with flipped houses representing 12.3% of all Q1 2026 sales in Atlanta — one of the highest shares of any major metro. (Ridge Street Capital) Smaller Georgia metros post even higher rates, including Warner Robins at 18.5% and Macon at 15.5%. (ahlend) That level of activity signals strong fundamentals, but also sharper competition for the same deals.

Coastal Florida tells a different story. Rising insurance costs are compressing flip economics even where foreclosure inventory is increasing — Florida homeowners insurance averaged $7,136 annually in 2026, a cost that raises carrying expenses and narrows the pool of qualified buyers. (Ridge Street Capital) Inland and suburban markets like Tampa and Jacksonville are holding up better than the coast. (ahlend)


WHAT THE TOP-PERFORMING MARKETS HAVE IN COMMON

Despite being in different parts of the country, the strongest-performing markets share several characteristics.

  • Inventory remains well below historical norms
  • Buyer demand continues to outpace available supply
  • Investor competition is relatively controlled
  • Resale pricing has remained resilient despite higher borrowing costs

These conditions have created an environment where disciplined investors can still generate attractive returns, even while national profitability remains compressed. (We Lend LLC, House Flipping Statistics)

WHAT IS ACTUALLY DRIVING DEMAND?

The numbers above are symptoms of larger structural forces. Three trends are shaping today’s fix-and-flip market more than any single quarterly ROI figure.


TIGHT INVENTORY IS SUPPORTING THE BEST MARKETS

The strongest-performing metros all have one thing in common. They simply do not have enough homes available.

Hartford’s active inventory remains roughly 63% below pre-pandemic levels. Buffalo shows a similar pattern. (Kiavi) That scarcity continues to support resale pricing throughout the entire holding period of a flip. Rather than competing against abundant inventory, investors in these markets benefit from limited supply and sustained buyer demand.


Key Takeaway   Inventory constraints, not lower interest rates, are creating the biggest advantage in today’s highest-performing markets.


THE FORECLOSURE PIPELINE IS GROWING

Another important source of deal flow is beginning to expand. Foreclosure activity has increased by roughly 20% year over year. (ahlend, citing ATTOM Foreclosure Market Reports) For real estate investors, that represents additional acquisition opportunities.

It is also important to recognize what those numbers represent. Every foreclosure filing reflects a household experiencing genuine financial hardship. Market analysis should acknowledge both realities. Rising foreclosure activity may increase inventory available to investors, but it also reflects growing financial pressure across many communities. That broader context matters when evaluating where today’s opportunities are coming from.


THE RISE OF THE FIX-TO-RENT HYBRID

Not every property purchased today is intended for resale. Increasingly, investors are building flexibility into their exit strategies.

According to the LendingOne–ResiClub survey:

  • 52% plan to convert between one and five projects into rental properties rather than selling immediately
  • 38% do not expect to convert any projects into rental properties

Investors call this the BRRRR strategy — Buy, Rehab, Rent, Refinance, Repeat. The “refinance” step is what makes it more than just a hold decision: once a property is rented and stabilized, investors can often pull much of their original capital back out through a refinance, then redeploy it into the next acquisition. That’s the mechanism behind the fix-to-rent shift showing up in the survey data above — it’s not just “keep it instead of selling,” it’s a repeatable capital cycle.

This fix-to-rent hybrid strategy has become significantly more common since 2023. Rather than relying exclusively on resale appreciation, investors are preserving the option to hold properties as rentals when market conditions make selling less attractive. The strategy is particularly common in the Midwest, which also reports the strongest buyer demand in the country.


Key Takeaway   The most successful investors are becoming more flexible. Many are underwriting every acquisition with multiple potential exit strategies rather than assuming every project will end in a sale.

HOW THE BEST-POSITIONED OPERATORS ARE ADAPTING

The industry’s strongest operators are not succeeding because the market has become easier. They are succeeding because they have adapted to a lower-margin environment. Instead of relying on rapid appreciation, they are competing through stronger capitalization, faster execution, and more disciplined underwriting.

The following trends show how that adaptation is taking shape across the industry.


CASH IS BECOMING A COMPETITIVE ADVANTAGE

Cash has always been valuable in real estate investing. Today, it has become a structural advantage. Recent data illustrates just how much the market has shifted:

About 63% of flips nationally are now purchased with cash; in the highest-ROI metros that share climbs to 81% in Buffalo, 77.4% in Cleveland, and 76.5% in Detroit. (ahlend) The financed share of flips declined from approximately 41% in 2022 to 37% in 2024. (We Lend LLC)


This trend closely mirrors the cost of borrowed capital. Published fix-and-flip loan rates during 2026 typically range between 9% and 13%, depending on borrower experience and leverage. (Grafton Funding, Fix & Flip Loan Rates in 2026)

When the national gross ROI sits around 25%, financing can consume a significant portion of a project’s potential profit. Well-capitalized investors simply have more flexibility. They can move faster, compete more aggressively, and pursue deals that leveraged buyers may no longer be able to justify.


Key Takeaway   Cash is no longer simply a financing preference. In today’s market, it has become a competitive advantage that directly influences which deals investors can successfully pursue.


LOWER INTEREST RATES ALONE WON’T RESTORE MARGINS

Financing costs have started to improve, but profitability has not.

Average bridge and fix-and-flip loan rates declined from 11.1% in September 2024 to 10.43% one year later. (Stormfield Capital) Meanwhile, 30-year mortgage rates stabilized closer to 6.5% during mid-2026. (We Lend LLC)

Those improvements have certainly helped, but they simply have not solved the industry’s biggest challenge. The larger issue is the cost of the asset itself.

The median purchase price for a flipped home reached $259,700 during mid-2025, the highest level recorded since 2000. (AmeriSave, House Flipping Loans 2026)

Acquisition costs reset dramatically during the pandemic and have remained elevated. Even as financing becomes modestly cheaper, investors continue entering projects with significantly higher purchase prices than they would have just a few years ago. That is why margins have not rebounded alongside interest rates.


DISCIPLINE IS REPLACING SPECULATION

The strongest investors are not succeeding because they are taking bigger risks. They are succeeding because they are taking fewer unnecessary ones.

Several trends illustrate how underwriting has evolved:

  • The $100,000 to $200,000 purchase price range is currently producing the strongest returns nationally, averaging approximately 31% gross ROI, the highest of any price band tracked (Kiavi, citing ATTOM Q3 2025)
  • Renovation timelines under 120 days are increasingly treated as a practical ceiling for minimizing carrying costs (ahlend)

Neither trend is accidental. When margins are thinner, every decision has a greater impact on profitability. A project purchased above the optimal price range or held for an extra month carries a measurable financial cost that investors increasingly account for during underwriting.

The operators still thriving in today’s market are not the ones who benefited from unusually favorable conditions during 2021. They are the ones evaluating every acquisition with greater discipline because today’s margins demand it.

LOOKING AHEAD

The first half of 2026 offers reasons for cautious optimism.

REASONS FOR OPTIMISM

  • Profitability has improved
  • Investor confidence remains high
  • Active investors continue to identify opportunities, particularly in supply-constrained metros with resilient buyer demand

REASONS FOR CAUTION

  • Margins remain historically compressed
  • Acquisition costs continue to challenge profitability
  • Performance varies dramatically between local markets

Perhaps most importantly, the industry’s most successful investors are adapting their strategies instead of waiting for the market to become easier. That may be the clearest signal in the data.

The fix-and-flip market is not returning to its previous normal. It is establishing a new one.


WANT A DEEPER LOOK AT WHERE THE REAL ESTATE INVESTING IS HEADED?

Download our comprehensive investor guide for additional research, metro-level analysis, and the emerging trends every real estate investor should be watching.


FREQUENTLY ASKED QUESTIONS

Is house flipping still profitable in 2026?

Quick answer: Yes, though margins are meaningfully thinner than they were a few years ago.

National gross ROI stood at 25.4% in Q1 2026, down from a 2016 peak of 54%. Profitability now depends heavily on market selection, purchase discipline, and access to cash rather than financing.

How much does it cost to flip a house?

Quick answer: Costs vary by market, but three components drive the total: purchase price, rehab budget, and holding costs.

Rehab typically runs 20% to 33% of after-repair value. (ahlend) In the $100,000 to $200,000 price band — currently the strongest-performing nationally — a disciplined operator might spend roughly $135,000 to purchase, $35,000 on rehab, and $1,800 on holding costs, totaling around $185,600 before financing.

Nationally, the median purchase price for a flipped home reached $259,700 in mid-2025, the highest level recorded since 2000, so costs scale up quickly outside that band.

How much profit can you make flipping a house?

Quick answer: It depends far more on execution than on the market alone.

Nationally, typical gross profit on a flip was approximately $66,000 in Q1 2026 — but that figure excludes rehab, financing, and holding costs. Modeled against published benchmarks, a disciplined, cash-funded operator might net around $10,900 in profit on a $196,500 resale, while an average, financed operator underwriting to the same headline ROI without adjusting for real costs can actually lose money. Gross ROI is a starting point for evaluating a market, not a promise about any individual deal.

Why are house-flipping profits down from a few years ago?

Quick answer: Mainly because acquisition prices reset structurally higher during the pandemic.

The median flip purchase price hit a 25-year high of $259,700 in mid-2025. Financing costs rose at the same time, and even though loan rates have started easing, margins haven’t recovered proportionally, suggesting the compression is structural rather than purely rate driven.

Will house flipping rebound in 2026?

Quick answer: Early signs point to stabilization rather than a full rebound.

Q1 2026 marked the first increase in flipping returns in nearly two years, but overall flip volume was still down both quarterly and year over year.

Which markets are outperforming the national average right now?

Quick answer: Constrained inventory metros in the Rust Belt and Northeast.

Buffalo, Pittsburgh, Cleveland, and Hartford are substantially outperforming the national ROI figure. Several Texas metros and Montana are underperforming due to oversupply and softer local demand.

Is now a good time to flip houses?

Quick answer: It depends heavily on which market and how the deal is financed.

Cash buyers in high demand, low inventory metros are working with meaningfully better economics than leveraged investors in oversupplied markets. The “is it a good time” question is now a local and capital structure question, not a national one.

How many houses are flipped in the U.S. each year?

Quick answer: 297,045 homes were flipped in 2025.

That’s about 7.4% of all home sales, down from a 2022 peak of roughly 407,000 flips, or 8.7% of all sales.

TALK WITH A TEAM THAT STUDIES THE MARKET EVERY DAY

Understanding the market is only part of the equation. If you’re looking for deeper insights, better market intelligence, or a partner to help you grow your investment business, we’d love to start the conversation.


Get Started